Got DotNet? Got Charting? Here’s .netCHARTING Then
If you know what was graphic programming, and charting in particular, in the pre-.NET era—yep, seen today it looks like a sort of Jurassic Windows—you can only thank the will of fate which made you approach this special branch of programming in the .NET age.
The .NET Framework comes with an advanced library of functions collectively known as GDI+ in honor of the glorious (and notorious…) Windows Graphics Device Interface—joy and sorrow (well, mostly sorrow) for a generation of Windows programmers.
GDI+ services belong to the following categories: 2D vector graphics and imaging. 2D vector graphics involves drawing simple figures such as lines, curves, and polygons. Under the umbrella of imaging are functions to display, manipulate, save, and convert bitmap and vector images. Finally, a third category of functions can be identified—typography, which has to do with the display of text in a variety of fonts, sizes, and styles.
As you can see, GDI+ only provides the bedrock of graphic development; using its low-level tools one can arrange for more advanced and sophisticated forms of graphics like charts. So long as you just need to render a series of data in vertical and flat bars self development is still an option. But when your customers begin asking for more?
Using plain GDI+ classes, producing a pie chart like this is definitely possible, but certainly not trivial.

The code to place labels at the center of the slice can be boring to figure out and write. The 3D style with lighting like above is a nice enhancement, but requires quite a few lines of smart code.
The bottom line is that, yes sure you can do it yourself but is it time and cost effective? More, does what you actually get—mind, at the cost of spending precious hours of non-business development—meet the expectations of the customer? And even when the result meets expectations, you’ve lost a great opportunity to exceed expectations at the same cost or even cheaper!
A pie chart is an eye-catching way of presenting data; but it is not appropriate just for every series of data. The real tradeoff is when you can switch it to alternative graphics with little changes. Trust me: the chart below is not that easy to craft.

Even harder is coming up with a manual implementation of a bevel chart like the one that follows. Effects like transparency, 3D style, backgrounds require code; and code requires time and money. And, more importantly, that is not the type of code you’re mostly paid for.

In summary, a professional help from a well-done graphic library is first of all a first-class service you offer to your clients. You ought to consider that. Always. (And don’t wait for the need to render a gauge graph to seriously consider that …)
What’s the Perfect Fit?
Choosing the right library may not be easy and, to some extent, is a matter of personal preference. However, any library you nominate must meet a few requirements in order to assist you developer in delivering a first-class service to your customer.
My ideal graphic library should be:
- Easy to use
- Sport a .NET-ish programming interface
- Supply a great variety of charts and speak the language of statistics and charting
- Be effective in terms of graphic results, required programming efforts, and costs
- Provide a rich user interface that goes beyond a long list of chart types to add support for stunning features like transparency, backgrounds, gradients, nice labeling, and more
- Be internally optimized for performance and offer control over certain features like caching and cache duration
Forgot something? Oh, sure. It doesn’t have to be overly complex and unwieldy. Because unwieldy software often scares me at first, I do love any piece of software that no matter how complex allows you to get started with a simple but significant example.
I believe that .netCHARTING meets all of these requirements. And, at least for me, it rocks.
Working with .netCHARTING
As amazing as it may seem, a simple .netCHARTING ASP.NET application is really simple. You start by registering the control assembly with the page and place an instance of the control in the ASPX source.
<%@ Register TagPrefix="dotnet"
Namespace="dotnetCHARTING"
Assembly="dotnetCHARTING"%>
:
<dotnet:Chart runat=server id=chart />
Next, you need to feed the control with some data to generate the chart. The .netCHARTING data model consists of elements which collectively become a series. The .netCHARTING control sucks data from a series. One or more series can be grouped in a collection and passed to the control.
The Element class represents an element on the chart and provides properties to hold different types of data such as X and Y values, percentage completed for Gantt charts, and many more. In addition, the Element class provides control over other attributes of a single element such as colors and markers.
The Series class represents a group of elements and provides default properties of all elements within it as well as specific properties for the series such as legend entries. The Series class comes with data manipulation methods through which you can, for example, sort elements and perform some calculation and derive new expression-based elements for the series.
You associate a series to the .netCHARTING control using the SeriesCollection property, as below:
Element e = new Element();
e.Name = "My Element";
e.YValue = 10;
Series s = new Series();
s.Name = "My Series";
s.Elements.Add(e);
SeriesCollection sc = new SeriesCollection();
sc.Add(s);
chart.SeriesCollection.Add(sc);
The code snippet first instantiates and name a new element and assigns a value for the Y axis. Next, it creates a new series and fills it with the previously created element. The Elements property on the Series class lists the elements currently within the series. Finally, the series is added to a SeriesCollection object which, in turn, is added to the same property on the .netCHARTING control. This code snippet is usually located in the Page_Load event. The Render method of the control accesses data from the bound series collection and render the chart.
While extremely flexible—you create elements individually—the preceding code is not realistic. In most cases, in fact, you get data to render from business objects that retrieve it from databases, Excel documents, XML streams. Business objects normally expose data using ADO.NET container objects like the DataSet or streaming interfaces like the data reader. To meet these requirements, the .netCHARTING control also accepts data from a DataSet. For consistency, though, the DataSet must be packed into a Series object. Here’s an example.
void Page_Load(object sender, EventArgs e)
{
// Set
global properties
chart.Title
= "Item sales report";
chart.TempDirectory = "temp";
chart.Type
= ChartType.Pie;
// Adding
series programatically
chart.Series.Name = "Item sales";
chart.Series.Data = GetDataSet();
chart.SeriesCollection.Add();
}
The Data property of the Series class can be filled with any ADO.NET enumerable object including readers. Feasible chart types are in the ChartType enumeration; the global properties you can set are function of the selected chart type.
The TempDirectory property controls the directory where images generated by the control are temporarily stored. You must provide writing permissions on this directory on the Web server machine. Each image is saved to a server file to avoid taxing the server memory. By default, the image is regenerated on every hit unless you set the CacheDuration property. When set, the chart image is generated on the first hit and preserved for the specified number of seconds. All requests coming in this period will be served accessing the cached image with no rendering work by the chart control. A Boolean property—UseFile—lets you indicate whether the generated image is saved as a file in the TempDirectory folder or streamed directly to the browser.
One more class that is worth mentioning is the DataEngine class. First and foremost, the DataEngine object can be configured to collect data either through queries against databases or consuming disconnected DataTable objects. The data is then converted to a SeriesCollection which is the only type of data the chart control recognizes. In addition, the DataEngine offers many handy data manipulation features specifically designed to serve common needs like date aggregation.
DataEngine de = new DataEngine();
de.StartDate = "1/1/02 8:00:00 AM";
de.EndDate = "1/1/02 8:00:00 AM";
de.DateGrouping = TimeInterval.Days;
de.SqlStatement = "SELECT names, values FROM
myTable " +
"WHERE start > #StartDate# AND end < #EndDate#";
SeriesCollection sc = de.GetSeries();
chart.SeriesCollection.Add(sc);
The DataEngine also supports date grouping done with the desired granularity—from years to minutes. In the newest version 2.5, .netCHARTING supports extensive arithmetic operations including average, minimum, maximum and many more. In earlier versions, only the sum operation is supported.
Often you need to display a chart to complement a grid of data or vice versa. The .netCHARTING control makes this feature as easy to implement as assigning the ID of the desired page DataGrid to the DataGrid property of the control.
chart.DataGrid = "myGrid";
The DataGrid property takes the ID of a grid control defined within the page. If set, the data represented in the chart is displayed in the specified grid control.
Advanced Capabilities
The .netCHARTING provides several advanced capabilities. I like to briefly discuss three of them here: drill-down, file manager, and the countless options for aligning text and inserting annotations.
Drill-down consists in the control’s ability to support a logically related chain of charts. The idea is that you display a first chart and by clicking each of the displayed elements to get into the data represented there obtaining a detail view. The level of nesting is up to you and exploits the aforementioned date grouping capabilities. Here’s an example:
Chart.DateGrouping = TimeInterval.Years;
Chart.DrillDownChain="Years,Quarters,Months,days=Days,hours,minutes";
Chart.DefaultSeries.DefaultElement.ToolTip="%yvalue";
The DrillDownChain property defines the various levels of detail you wish to see. No other code is needed.
All charts generated by the control can be saved to a server-side file. You do this using the FileManager object. The SaveImage method and the ImageFormat enumerated type allow you choose name and format of the image file. The code below shows how to save the chart to a file which is then assigned to the ImageUrl property of an ASP.NET Image control.
img.ImageUrl =
Chart.FileManager.SaveImage(Chart.GetChartBitmap());
In the newest version 2.5, even the legend can be taken out as a distinct image file. You use the code below to assign the bitmap of the legend to an Image control within the host page.
leg.ImageUrl =
Chart.FileManager.SaveImage(Chart.GetLegendBitmap());
In version 2.5, .netCHARTING also fully supports image maps—that is, images that include hotspots for clicking. The control exposes the ImageMapName property to let you assign a name to the map and ImageMapText to insert the <area> HTML block that physically represents the list of clickable areas within the chart.
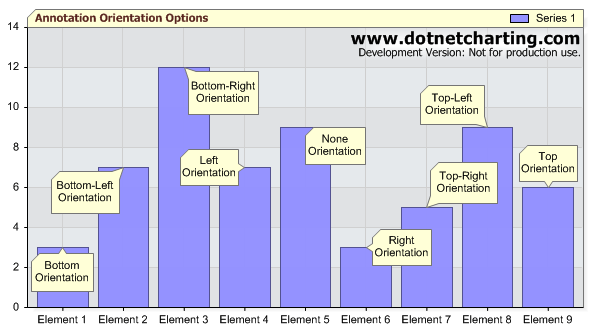
An annotation is a box of text with a position, data source, and hotspot functionality. You can associate annotations with elements of a chart like in the picture below.
Tooltips and legend boxes can be defined based on a text template. Here’s an example:
chart.LegendBox.Template ="%icon %name";
You define a template by composing special syntax elements known as tokens. A token is a name prefixed with a percentage sign. Several tokens are predefined for you to incorporate commonly used data. For example, the legend template shown above displays the icon and the name of the entry. In this case, the icon is a small rectangle reproducing the same graphic fill of the corresponding chart element. The name instead is the name assigned to the element in the series of data. See the documentation for the complete list of supported tokens for each chart component.
Summary
In .netCHARTING, the list of supported chart types is amazingly long and rich (gauge charts are the latest entry), but not endless; meaning that the .netCHARTING control is overall well balanced. It is not too big for memory, and is not too slim as far as capabilities are concerned. Each element of each series can be easily customized based on runtime conditions—for example, you might want to change the color of all slices representing sales that exceeded expectations. Labeling, coloring, and styling are pretty rich too. For more details, the documentation is quick with brief explanations and, better yet, adequate code snippets in C# and Visual Basic .NET.
Another aspect to emphasize is that to effectively use the control you don’t have to be a .NET guru or super-expert. Some shortcuts like the date aggregation features of the data engine are designed to answer common requirements and make it simple also for professionals other than experienced .NET developers. Bear in mind, the one of strenghts of this component is that you build an effective data-driven chart with only 4 lines of code. Want an example?
chart.TempDirectory="temp";
chart.DefaultSeries.ConnectionString =
"data.mdb";
chart.Series.SqlStatement= "SELECT Customer,
Sales FROM Table";
chart.SeriesCollection.Add();
Admittedly, this article only scratched the tip of .netCHARTING iceberg but it is enough to illustrate the main themes of this control. The next step is up to you. Enjoy!
Dino Esposito is a trainer and consultant based in