User Interface
The user interface is comprised of several widgets and features that facilitate navigating through different ranges across the x axis in an intuitive manner. Different features provide similar functionality but each has its own advantages that are ideal for the different tasks one would need to accomplish. This section describes how these features are used by end users.
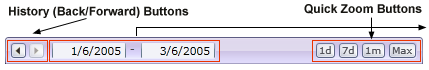
The Navigation bar contains a number of controls to facilitate range selection. The history back and forward buttons can be used to navigate through previous views similar to a web browser. When history is available the buttons will be active, otherwise they are grayed out. The quick zoom buttons can automatically zoom to a predefined range such as 1 day or 1 month with time scales or predefined numeric ranges. The range selectors seen on the right are an innovative new type of date, numeric, and category selector/iterator. When using it with a time scale, it enables quicker date selection than a traditional calendar while still providing day of week and month names. Values can be typed into the text box directly. The arrow buttons can be used to iterate numbers, element names, or the different parts of dates like day, month, and year individually. When using a date entry control (such as a calendar) it is often necessary to iterate the selection by one month or one year and the buttons provide quick and easy way of donig that. However, when large changes are required, the butttons also provide click and hold functionality that iterates many values quickly without using the keyboard to type them in manually. When using click-hold with the day and month buttons, the values will pause when they reach the first day of the month or first month of the year, respectively. This gives a little more control when using click-hold and also provides an easy way to reset the day or month selections back to 1.
|
Range Selectors |

|
Chart Area The chart area can be scrolled by dragging it when the hand cursor appears and a new selection can be made when the crosshair cursor is showing. Using the scrollwheel to zoom in and out is available at any time. Dragging is not available when the chart is fully zoomed out. When both dragging and selection is available, the top part of the chart area can be used for dragging and the bottom for selection, the ratio of drag to selection area can be specified programatically. The chart area axis also supports cell selection. Preview Area The preview area is used in conjunction with the scrollbar to visualize the chart area view in relation to the entire range of data. It supports cell and arbitrary selection, dragging handles that mirror the scrollbar handles and scrollwheel zooming. When both cell and arbitrary selection are enabled, they can be used at the same time. For example you can start by selecting a cell and end the selection at an arbitrary position and vice versa. Clicking near the top of the preview area starts the selection in cell mode while clicking near the bottom starts it at an arbitrary position. Moving the mouse pointer up or down allows switching between the modes during selection. Our studies have shown that using only cell selection is more intuitive for first-time users. Using mixed selection is more powerful however, and can be useful when the end user is is someone who uses the chart often.
Note: When using mixed or arbitrary selection, clicking once without draging out a selection will center the scrollbar at the clicked position.
Arbitrary & Cell Selection on the preview area is demonstrated here:
Sample: Feature Set > Navigator > NavigatorSelector |
Special Cursors  Hand Cursor Hand CursorIndicates drag scrolling is available
|
 Crosshair Cursor
 Cell Cursor
Scrollbar
The scrollbar looks very similar to a traditional scrollbar and it supports all the traditional scrollbar features, however, it also provides a number of new ways to manipulate it.
Traditional Scrollbar Features
- Drag scrolling
- Click outside the scrollbar to make it page to the mouse location.
- Click buttons at each end for smooth and controled movement.
New Features
- Drag handles of the scrollbar to zoom one side in and out.
- Double-click scrollbar handles to zoom one side out completely.
- Double-click the bar to zoom out completely. Double-Click again to zoom back to the previous position.
- Drag the bar up or down to put it into zoom mode. i.e. drag the horizontal scrollbar up to zoom in and down to zoom out.
Other Features
Chart Area Legend
Each chart area contains a legend that describes the visible data. It updates dynamically as the view changes. This legend also provides information on data at any mouse position when the mouse is hovering the chart area or preview area, and info on data while selecting a new zoom range. These features are mouse and selection tracking described below.
Mouse Tracking
The chart can track the mouse position to determine the values of data at those positions. The mouse is tracked across the chart area and preview area and the values are reported in the respective chart area legends. When hovering cells on axes, the legends will reflect calculations based on the ranges of those cells.
Selection Tracking
When selecting ranges on the axes or chart area, the part of the chart being selected shows in color while the rest is grayed out to indicate what the user is doind. Information about data within the range being selected shown in chart area legends.
Deep Zooming
When the scrollbar becomes very small, it will zoom the preview area in so it can be used more precisely and allow zooming in even farther. The zeep zoom will not always happen as soon as the scrollbar becomes as small as possible. There is a feature that prevents this while hovering the scrollbar area. The purpose of this is to prevent unintentional deep zooming in cases such as when the right handle is moved all the way to the left and you intend on moving the left handle all the way out.
Drag & Throw
When dragging the chart area with the hand cursor, the chart area can be thrown to improve the chart area scrolling usability. This is a common UI feature in many touch-screen applications. In order to achieve this, the mouse button must be let go while the mouse is in motion. The faster the mouse is moving when the button is released, the further the chart will scroll on its own.