This tutorial describes how database queries can be used to populate chart series and elements.
Simple chart
By default, the first column returned by your query is mapped on the x axis and the second column is mapped onto the y axis.
Consider:
'SELECT name, age FROM Employees'
This query will create a chart where the names are on the x axis, ages on the y axis, and might look something like this:
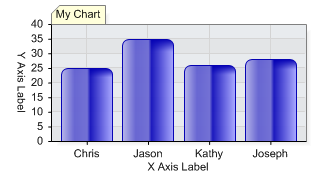
Figure 1. Using a simple query
Multiple series from a single query
Returning a third column splits the data into series. This feature is referred to as 'SplitBy'.
Consider:
'SELECT name, age, division FROM Employees GROUP BY division'
This time 3 columns are returned and rows are grouped by the division column. Because the third column is supplied, two series are created, one for each unique value of the division column. The resulting chart will look something like this:
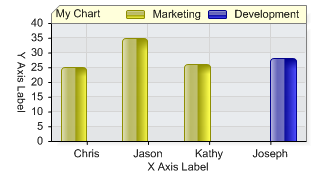
Figure 2. Multiple series using a query
'SELECT Date, Items_Sold, Sales_Rep FROM Sales GroupBy Sales_Rep'
In this case the sales of each representative are aggregated for each month.
Figure 3. Multiple series with date grouping.
Count occurrences of a fields value.
For this case, let's say we have a table which is a log of logins into your main company server. The table contains a 'date' column and a 'name' column and each row is a login entry. To show the number of logins for each user we can use the following query:
Query:
'SELECT name, 1 FROM Orders GROUP BY name;'
This will create a table with a name and a value (1) for each login. This method takes advantage of the DataEngine's aggregation feature and the second column will be summed.
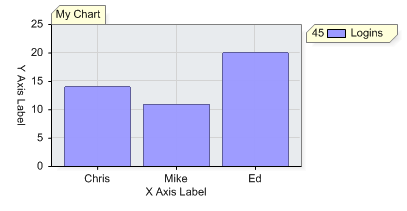
Figure 4. Counting occurences.