 Ajax Scrolling implementation
.netCHARTING 5.0 adds an advanced AJAX scrolling implementation. Within an
user defined viewport, users may use scroll bars or scroll arrows to navigate a
larger chart view. Chart rendering occurs only as needed for the currently
viewed portion of the chart. In addition to using scroll bars, users can use the
familiar click / drag interface, common to mapping applications, to navigate.
.netCHARTING Ajax automatically synchronizes the scroll bar positioning when
utilizing click drag or scroll bars can be disabled if not required.
 Ajax context menu
A right click context menu exposes powerful interactive options for zooming and scrolling including zooming specific axis, enabling zoom or drag, zooming in or out and showing the original zoom constraints.
 Ajax scrolling viewport positioning
The new scrolling functionality enables you to define data ranges for the viewport (e.g. 10 elements, a specific date range or numeric value range).
In addition, you can define the scroll starting position or range. Using these features together, you can display a large data set with a starting position at the specific information clients are most interested in while providing them easy access to surrounding values through simple scrolling or familiar click drag interfaces.
 Ajax Zooming implementation
In addition to scrolling and click drag navigation, advanced zooming
functionality is supported. Users may select from box or cross hair selections
for zooming, zoom on x and y concurrently, y only or x only and navigate the
zoomed view through scroll bars, click drag or both.
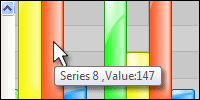 Ajax ToolTip display:
When in a scrolled or zoomed view, tooltip functionality is still available
utilizing a transparent callback to obtain the regular element tooltip value and
display this clientside on hover for the current cursor position within the
chart.
Ajax Auto updating implementation
For scrolling, zooming or both, the underlying chart may now be automatically
updated on a fixed interval. This update occurs in the background and the
rendered sections in view are automatically updated without a page reload.
 New shading effects
Continuing our innovative shading effects, .netCHARTING 5.0 provides brushed
metal and chrome visualizations for a variety of chart types. Shading effects
provide the visual impact of 3D charts with the legibility of 2D charts.
 Pie Shading Effect additions
A new glow effect has been added for 2D pie charts. In addition, the new
brushed metal and chrome effects are also supported on 2D pies charts.
 Bubble Shading effect additions
In addition to the new brushed and chrome shading effects, a new bubble
specific visualization option has been added. All three are now supported for
both regular and stacked bubbles.
 Background Shading additions
The powerful background object in .netCHARTING enables easy customization of
annotations, boxes, title boxes and more. The new metal shading effects are now
supported for backgrounds.
 Thermometer shading additions
Brushed and metal shading are now supported in thermometer gauge charts.
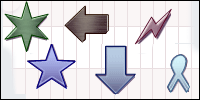 Shaped Bubble shading support
Bubble shapes enable pictorial representations and can scale in size when
used in bubble charts. Shading effects for brushed metal and chrome are now
supported for bubble shapes.
 Interpolated value calculations
Now it is simple to obtain the interpolated value for a given x or y value
with a single method call. This enables you to obtain the value between elements
for example if you had data points of sales for the first of every month you can
now plot or obtain the value for any day between those dates.
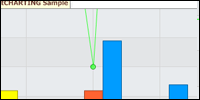 Axis Range adjustments on a per series basis
Now a simple setting enables you to exclude a given series from .netCHARTING's
intelligent axis range calculation.
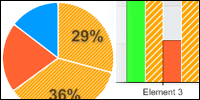 Selective default element settings
This new feature enables you to apply element defaults conditionally based on
specific criteria. In such a case, only the elements matching the criteria you
specify will take on the defaults defined. These smart defaults may be applied
at the series or series collection levels to apply to any elements they contain.
Inverse Series Trim
Developers have come to depend on series trim as a quick and efficient way to
cull data points from a given series. Now a new setting enables the inverse of
series trim. For example, if you trimmed weekends for a specific chart and now
wanted a similar chart including only weekends, you could accomplish this with a
single line of code.
 Legend box absolute positioning and sizing
The already flexible legend box has been further enhanced with the ability to
utilize any size and position you wish. You may also set only the position and
have the size automatically determined based on the legend box contents.
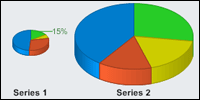 Pie chart absolute positioning and sizing
Now individual pies can be sized and positioned as you wish within the chart.
In addition to layout flexibility, this allows for unique pie within slice
charts and other custom compositions.
Radar chart absolute positioning and sizing
Individual radar charts can now be sized and positioned within the chart. In
addition to layout flexibility this allows for unique combinations of large and
small radar charts within the same chart.
 Label Image Support
Any chart label can now accept an arbitrary image in place of the label text. This feature opens a new world of labeling and visualization
possibilities for your charts.
 Smart label absolute positioning
Now you can override the automated label positioning and specify an absolute
position if required for your chart design.
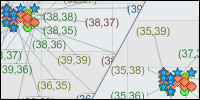 Smart Label padding
Labels may now be configured with padding settings which influence the
automated layout algorithms ensuring that padded areas do not overlap.
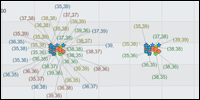 Smart Label Distance
A new maximum distance threshold for smart labels enables .netCHARTING to
only render a smartlabel if it can cleanly fit cleanly within the distance
threshold defined.
Mapping Label Once Option
For maps it is common to have many small land masses (islands or separated
areas) that may contain the same label (e.g. country name). This option ensure
that a given entity is only labeled once.
Ranged tick enhancements
When rendering in a compressed area, the new ranged tick implementation self
tunes to avoid an overlap or non visually pleasing result.
 Pie Labeling Enhancements
In cases where a large number of slices are concentrated in one small section
of the pie the labeling system has been enhanced to ensure each can be cleanly
labeled.
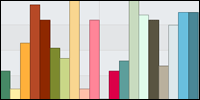 Multiple Palette support
With the addition of 5 color palettes in 4.4 we have seen requests for
multiple palette support. This new feature enables you to add any number of
palettes to a chart which will be allocated in order as required.
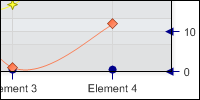 Axis Tickline linecaps
Line caps are now supported on tick lines and enable enhanced visibility and
improved aesthetics for specific chart applications.
 Category Axis Ranged Tick support
Now ranged ticks can be easily defined on category axis, for example to
select all employees from Bill to Jane. Tick index numbers may also be used to
define ranged ticks.
 Smart Chart Optimization
A dedicated small chart mode enables very small charts ideally suited for
absolute positioning and combination charts. Small charts are also useful for
including in labels as part of the new image label support.
 Optimized Branding Implementation
.netCHARTING is unique in that it offers free development and test licenses
for webforms (asp.net) usage. The "not for production use branding" for this
free license has been enhanced to ensure very small charts remain legible during
development and testing.
Enhanced Documentation
In addition to detailing the extensive new features in .netCHARTING 5.0, the
new documentation now includes an improved programmers’ reference which links to
real world sample code.
Enhanced Performance for very large data sets
.netCHARTING is ideal for charts with large amounts of data and chart
elements. The large data set handling has been further enhanced to increase
performance and lower memory requirements.

 Ajax Scrolling implementation
 Ajax context menu
 Ajax scrolling viewport positioning
 Ajax Zooming implementation
 Ajax ToolTip display:
 New shading effects
 Pie Shading Effect additions
 Bubble Shading effect additions
 Background Shading additions
 Thermometer shading additions
 Shaped Bubble shading support
 Interpolated value calculations
 Axis Range adjustments on a per series basis
 Selective default element settings
 Legend box absolute positioning and sizing
 Pie chart absolute positioning and sizing
 Label Image Support
 Smart label absolute positioning
 Smart Label padding
 Smart Label Distance
 Pie Labeling Enhancements
 Multiple Palette support
 Axis Tickline linecaps
 Category Axis Ranged Tick support
 Smart Chart Optimization
 Optimized Branding Implementation