Introduction
This section will go over a number of issues that affect the performance of chart rendering. Please note that these tips are not necessarily required in normal scenarios. They are shown here in order to improve performance when it is crucial. There are several things to consider when creating charts that require high availability and performance.
Data Acquisition
The chart DataEngine provides an array of features to group and manipulate data tailored for chart use. If this process becomes inefficient due to large dataSets or other reasons, some improvements can be made.
- Instead of the DataEngine acquiring data from the database, getting a dataTable manually and passing that to the dataEngine may improve performance.
- The absolute fastest way to populate a series is to do it manually like most of the gallery samples do. This enables the developer to have full control of the process and apply performance tweaks were necessary.
When a WinForms application is run in debug mode with Visual Studio, it executes the app.vshost.exe application in the bin folder and runs much slower than the app.exe file which is also available in the bin folder.
Chart Rendering
Charts with less than 200 Elements.
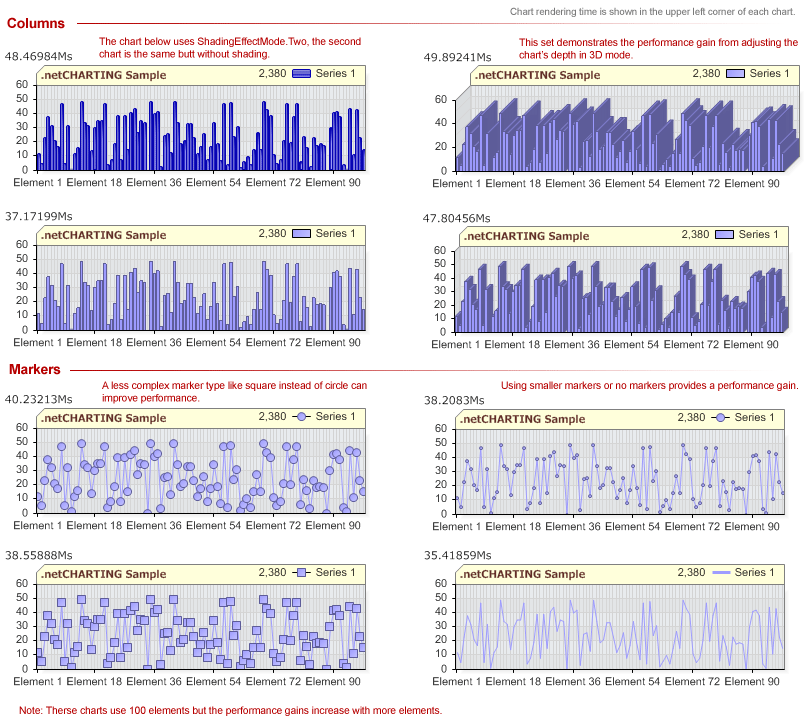
When there are few data elements on a chart, the data processing time is largely minimal. Drawing the image takes the majority of time. The more fancy the chart, the slower it will render. Not to say that charts render showily, however, in certain circumstances every millisecond counts. So, how can this process be sped up? Consider this, everything that is drawn on a chart requires time and the more complicated the drawing (shading effects, gradients, shadows etc.) the longer it takes.
Another very important fact to consider is the chart size. The larger the chart becomes the longer it will take for GDI to generate it. There is however an exception to this rule. When charts are so small that they have to be scaled down to fit into the image they are actually drawn at a larger size than specified, then scaled down so this will require more processing time. You'll be able to tell how much a chart is scaled by looking at text labels and compare their size to non-scaled versions of the chart.
The following chart grid demonstrates the performance impact of some settings.

Tips & Summary
- Dont use chart features that are not useful like element labels that are too small to read.
- Use less visually complex elements. (Square markers instead of circles or no shading effects.
- Set box background, line, and box shadow colors to Color.Empty.
- Use color transparency sparingly.
A more complex algorithm is necessary to blend backgrounds with partially transparent color fills. - Using Chart.PrinterOptimizedText may seem like it will improve performance because text is not anti-aliased, however, the performance gain is trivial.
- Chart size can make a dramatic difference in performance but the gain is lost when the chart gets too small to fit into the image in which case, it is rendered at a larger size and scaled down to the image size.
- Using Label.Shadow and Label.GlowColor may introduce a reduction in performance as these operations are CPU intensive.
- Use SeriesType.Line instead of SeriesType.Spline if possible. The line type is much faster than spline.
Charts with 200+ elements.
With a large number of elements the performance scale begins to tip towards data processing. Certain element features may take a few extra cpu ticks due to processing such as token replacement for element tool tips, labels and other hotspot attributes. The more tokens used in element properties the longer processing may take. Using element markers for series with thousands of elements might also be a bad idea because each marker must be drawn individually.
Memory performance.
If memory usage is a factor there are a few things to be aware of. First, memory usage can be tweaked only when charts are showing a large number of elements, otherwise, these tips will provide marginal benefits.
Element properties such as smart label, markers and hotspots are not instantiated by default. They are instantiated when the properties of those objects are used. For instance using code such as: Chart.DefaultElement.SmartLabel.Text = "%Name" will create a SmartLabel instance for the default element and eventually for each element on the chart.
Ajax Zoomer Performance
The ajax zoomer can sometimes have performance issues if the chart is too complicated. When the property Chart.Zoomer.UseSections is set to false, the zoomer will generate and upload the entire chart image at once. In some scenarios this can make zoomer charts work faster.
Update your DLL to at least version 6.2 for use with zoomer. A number of performance improvements have been made in the 6.2 release that greatly improve zoomer efficiency.
Use Navigator
The navigator was designed to outperform any other comprable software. It can handle very large dataSets and let users navigate through it similarily to advance yahoo or google finance charts. When possible, it is a good choice over using Zoomer.