Silverlight charts have come into their own
the Silverlight platform has matured and enabled powerful
new charting implementations such as the Silverlight Navigator
for asp.net. Now you can implement best of bread
interactive Silverlight charts including financial and stock
charts without any development experience with Silverlight
required.
In addition to advanced interactive stock charting which
usability testing has shown to be more efficient, higher
performing and more advanced than similar solutions by Yahoo
Finance and
Google finance, the .netCHARTING Silverlight Navigator brings
this power to your own chart solutions and non-financial chart types
including line charts and bar charts with advanced shading
types. For the first time, developers are able to leverage a
true bleeding edge user interface with their own sales,
inventory and traffic data untreated to stock charts.
Furthermore, the
.netCHARTING DataEngine automates the retrieval and formatting
of records from your own database for display by the seamlessly
integrated Silverlight control.
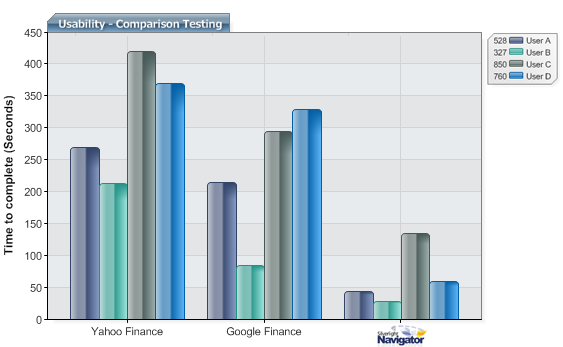
The chart above--created with .netCHARTING--represents usability
test results from a cross section of users including:
User A: Professional User (Academia), no financial domain
knowledge.
User B: Developer, previous experience with Yahoo Finance and
Google Finance.
User C: Home User, no financial domain knowledge.
User D: Business User, no financial domain knowledge.
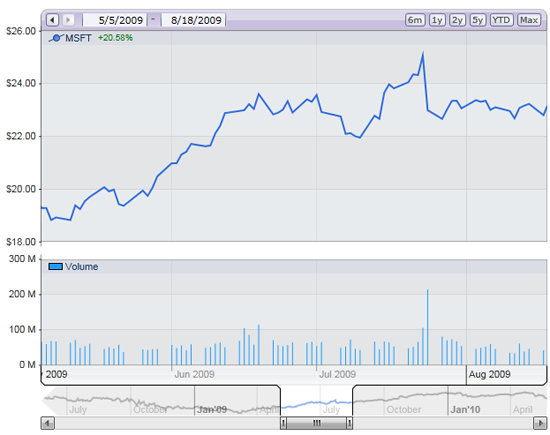
The .netCHARTING Silverlight
Navigator provides a dynamic stock chart interface
significantly more advanced and user friendly than
Google Finance and Yahoo Finance. Advanced functionality
includes real-time scaling, deep zoom, animated
transitions, history with undo support, an innovative
range and date selector, arbitrary selection and much
more. View:
Silverlight Navigator live demos.