.netCHARTING Overview
.netCHARTING combines visually stunning graphics and a comprehensive interface to bring you one of the most compelling charting solutions available for any platform.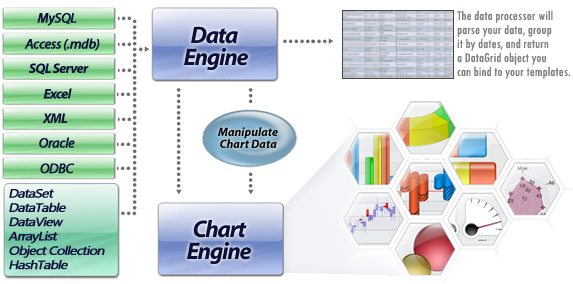
.netCHARTING utilizes the .NET framework and GDI+ providing a managed charting solution for C# and VB.NET developers working with ASP.NET or WinForms. Using the latest Microsoft technologies has enabled us to step beyond existing visual charting standards and produce visuals much stronger than typical dynamic charting solutions. In fact, we hope you will agree that the .netCHARTING visuals are even superior to high end desktop charting applications!
Major Features & Benefits
Charting Firsts
For years, .netCHARTING has pioneered new charting technologies, bringing clients unprecedented ease of use and automation without sacrificing the stunning visuals we have become renowned for. While competitors scramble to emulate our innovations, our clients continue to benefit; saving thousands of dollars in development costs through the rich set of Enterprise level features included with each and every .netCHARTING license sold.
-
JavaScript and HTML5 Charts

A powerful new JavaScript and HTML charting solution has been added in .netCHARTING 7.0. Easily enable JavaScript Charting with seamless mobile, iOS, Android and tablet support, at no additional charge, with every .netCHARTING license sold. In addition to visual parity with .netCHARTING's stunning server-side output, our JavaScript charts provide advanced animation and rich client side interactivity support.
-
Modern Web Aesthetics
Get a fresh new look for your old charts without a single line of code! Automatically improve the look and feel of your legacy charts simply by using the latest version of .netCHARTING. If you are attached to your legacy look, you can easily maintain it with a simple setting and enable the new look on a chart by chart basis instead.
-
Calendar Pattern Support

Define custom calendar patterns to implement axis markers. Calendar patterns will enable you to highlight a specific event or region of your data which reoccurs including marking weekends or other recurring events. They can also be used to trim data and to specify scale breaks.
-
InfoGrids™
InfoGrids™ produce results similar to data grid controls; however, they are created and drawn within the chart image itself. As a result, an InfoGrid™ can be styled to produce a significantly more polished and integrated grid that users can take with them, along with that chart, in a single image file.
-
Label Tokens and Expressions
Use tokens and mathematical expressions within labels to simplify the creation of dynamically generated labels.
-
Box Header Styling
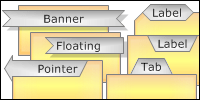
An advanced new box header system has been added supporting 10,000+ unique combinations with the advanced alignment and endcap visuals, shadows, offsets and much more.
-
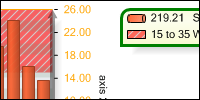
Scale Breaks
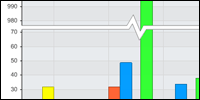
Often a chart has a few outlier data points which result in charts that are not legible for the bulk of the data. For example, if you had a chart of 100 values between 1 and 10 but 2 of the values were over 1,000 you could not accurately determine the values due to a compressed scale.
-
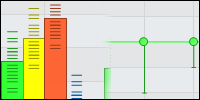
GIS Mapping Support
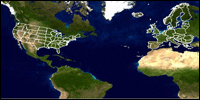
Maps support unlimited numbers of layers and can accept real data, readily available online, for the entire globe.
-
Chart Mentor
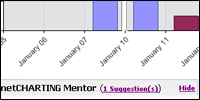
The chart mentor offers useful tips and samples based on the chart you are creating. It can help you resolve problems and improve the implementation of your chart in the most efficient way.
-
ImageBars™
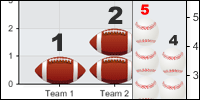
ImageBars™, provide stunning themed, pictorial representations in bar form.
-
Multiple chart areas sharing axes.
Create multiple independent chart areas within a single chart image. Advanced automatic alignment functionality enables a single axis to span multiple chart areas and automatically align with each other.
-
Axis Zooming
This innovative new feature can also be combined with interactive image map features of .netCHARTING for drill down zoom functionality.
-
More Charting Firsts
Other innovative features .netCHARTING has pioneered include:
- Smart Labels
- Automatic Drill Down
- Automatic Date Aggregation
-
- Automatic Scale Unit conversion between over hundreds of different units of measure.
- Multi-Color Lines and Splines.
- Legend boxes with customizable columns.
Essential Features
-
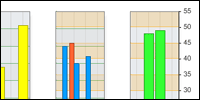
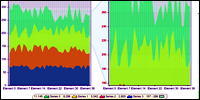
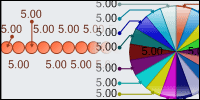
Stunning Visuals
The inclusion of more visually appealing charts will help expand the appeal of your application or web site to a broader audience.
-
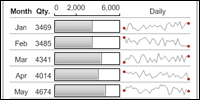
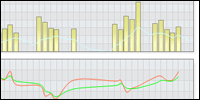
MicroCharts
MicroCharts are miniature versions of actual charts, designed to help viewers understand complex relationships between data in repetitive scenarios such as data grids or InfoGrids.
-
Unparalleled Customization
As charting requirements become more advanced, it is crucial that your charting component is able to keep up to your developers' demands. .netCHARTING is extremely flexible and able to meet even the most extensive requirements.
-
Element Sub Values
As part of a comprehensive system for representing errors in collected data, .netCHARTING supports multiple sub values rendered as error bars, lines and markers.
-
Statistics / Financial Indicators
Advanced statistical and financial indicators are built into the .netCHARTING API providing quick access to complex data analysis functionality.
-
Chart Type Customization
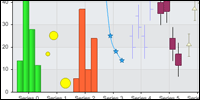
With our powerful and flexible approach to chart types different series can be set to different chart types at the same time in the same chart!
-
Data Sources
Utilizing a flexible UI for data acquisition, virtually any data source can be used to populate charts with data.
-
Comprehensive Output Formats
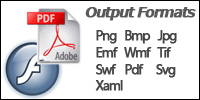
Output formats are available to accommodate any scenario.
-
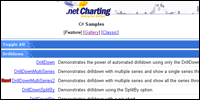
Hundreds of samples
-
A comprehensive array of samples and tutorials ensures that you will be able to quickly jump start your chart development without needing to review the extensive API documentation which is also available.
Smart Features
.netCHARTING's unique "Smart" features allow you to concentrate on the project at hand while the component automatically tunes the chart to meet your specific needs.
-
Smart Label™ Support
The “smart label” system ensures that labels do not collide or overlap even when chart elements are very close to each other.
-
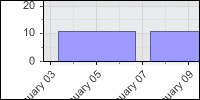
Smart Time Axes
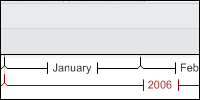
A unique feature which quickly, intuitively and, with a minimum of labels, conveys time related data on the axis.
-
Automatic Date Aggregation
Automatically group data by weeks, months, years and more - before the chart is plotted.
-
More Smart Features
Other innovative Smart features .netCHARTING includes:
- Automatic Time Labels
- Automatic Time Ranges
- Automatic DrillDown
- Smart Minor Axis Ticks
- Smart Scale Breaks
- Smart Forecasting
- Annotation Orientation
- Pattern recognition based element ordering.
Past and Future Development
See the complete version history for a detailed summary on the rapid innovations included in .netCHARTING since its original release. We are totally committed to meeting customer needs and provide priority support along with all major and minor upgrades with an affordable subscription offering.
