Digital dashboards are now a common requirement for business intelligence and .netCHARTING offers extensive features for dashboards and reporting. InfoGrids™and microcharts work together to display important metrics including Key Performance Indicators (KPI). Executive dashboards offer managers immediate, at-a-glance updates on the core metrics of their business or departments.
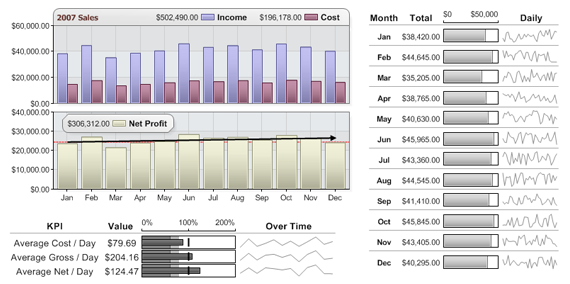
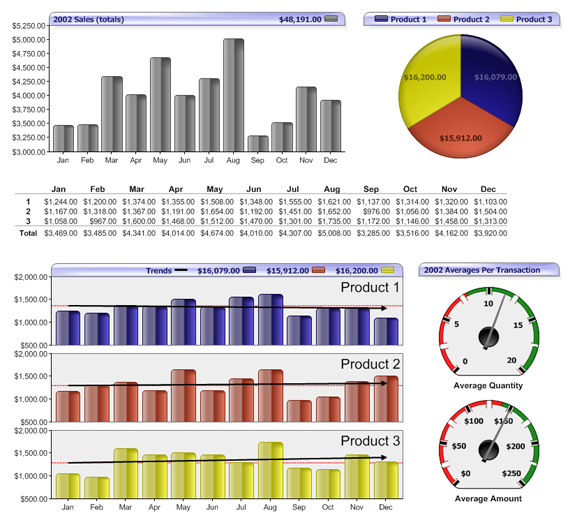
This digital dashboard demonstrates combining various chart elements to create a complete business intelligence portal.
   |
Digital dashboard
components include a full range of MicroCharts
including bars, gauges, progress
bars, bullets, sparklines, area lines, scales, pies and
markers. InfoGrids™ provide the ability to incorporate text based data within your digital dashboards and mange the chart and image in a single file that is simple to view, email or incorporate into print documents. Sparklines combined in InfoGrids™ result in powerful charts that quickly communicate business management trends. Gauge bars and progress bars support shading and advanced data visualization options unique to .netCHARTING. |
Business Intelligence Chart Dashboard:
Organization chart illustrating vertical layout, line thickness and color customization, metallic shading, per group color customization and picture display.
View more ASP.NET Chart Types, View Gauge and Dial Charts, View Organizational Charts